In financial trading, regardless of any market, traders must understand the basic candlestick patterns to better understand market sentiment, so that traders can make more accurate decisions, minimizing risks.
See also: The concept of Japanese candlesticks
Join BlackManTrader to learn the basic candlestick patterns as well as price action and advice of each candlestick type
BULLISH AND BEARISH CANDLESTICK PATTERNS
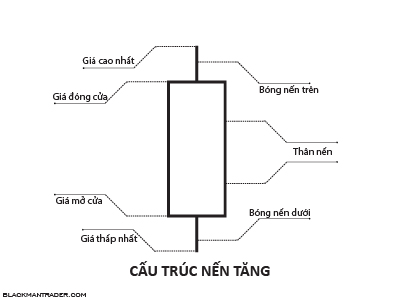
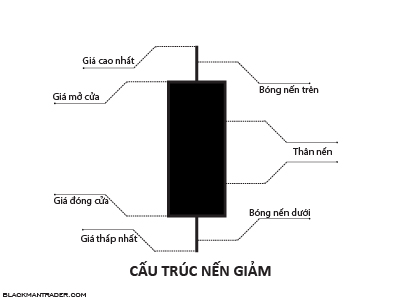
In some cases, depending on the user’s preference, the colors of white and black candlesticks or blue and red can be used, here Blackmantrader uses 2 basic colors, so White and Black to illustrate
BASIC CANDLESTICK PATTERN: CANDLESTICK INCREASE
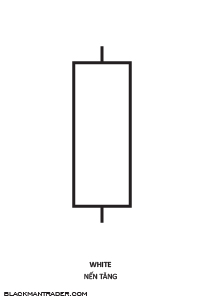
Describe:
The candlestick body is moderate, the closing price is higher than the opening price;
Price action:
Average buying pressure, buyers are in control
Advice:
Bullish candlesticks when standing alone hardly give any significance to note. The market is just maintaining the current trend. There is no notable news or action at this time
BASIC CANDLESTICK PATTERN: CANDLESTICK DIMINISH
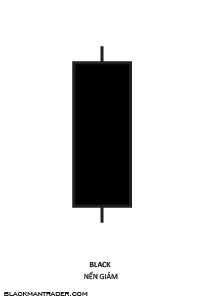
Describe:
The candlestick body is moderate, the closing price is lower than the opening price
Price action:
Selling pressure averages, sellers are in control
Advice:
Candles when standing alone hardly make any sense to note. The market is just maintaining the current trend. There is no notable news or upheaval at this time.
BASIC CANDLESTICK PATTERN: CANDLESTICK LONG INCREASE
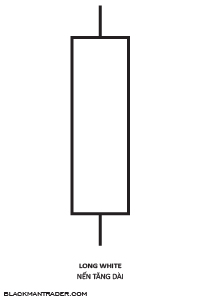
Describe:
The candlestick body is long, the closing price is higher than the opening price
Price action:
Strong buying pressure, buyers are in control;
Advice:
Long bullish candlesticks, if appearing in special price zones, can be seen as a trend reversal signal. However, it is necessary to combine with neighboring candlesticks to increase trading performance
BASIC CANDLESTICK PATTERN: CANDLESTICK LONG REDUCTION
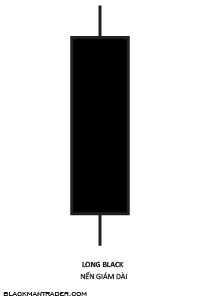
Describe:
The body of the candlestick is long, the closing price is lower than the opening price
Price action:
The selling pressure is strong, the sellers are overwhelming and the battle for control
Advice:
Long bearish candlesticks, if appearing in special price zones, can be considered a trend reversal signal. However, it is necessary to combine with neighboring candlesticks to increase trading performance
See also: Candlestick chart at wikipedia


