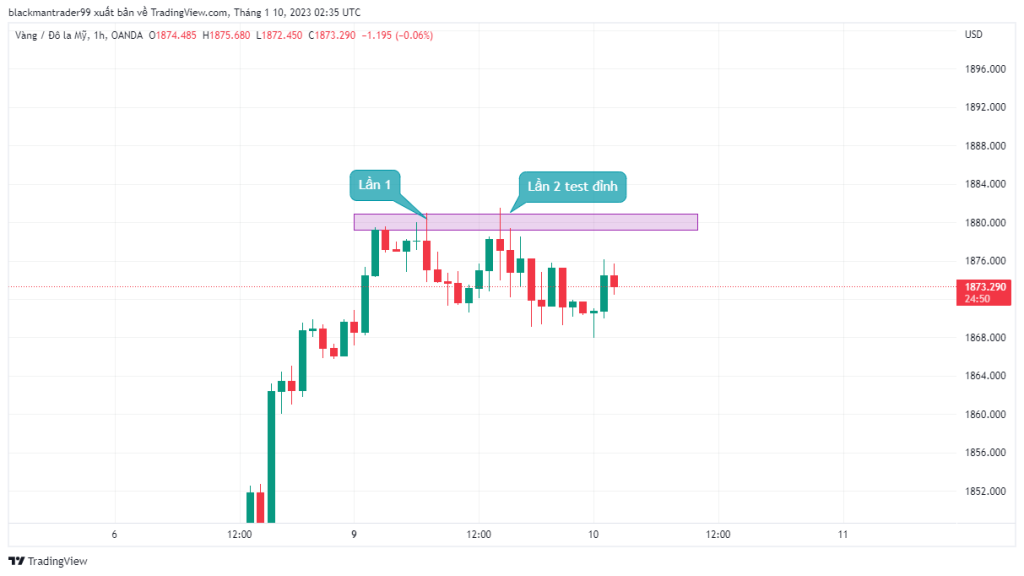
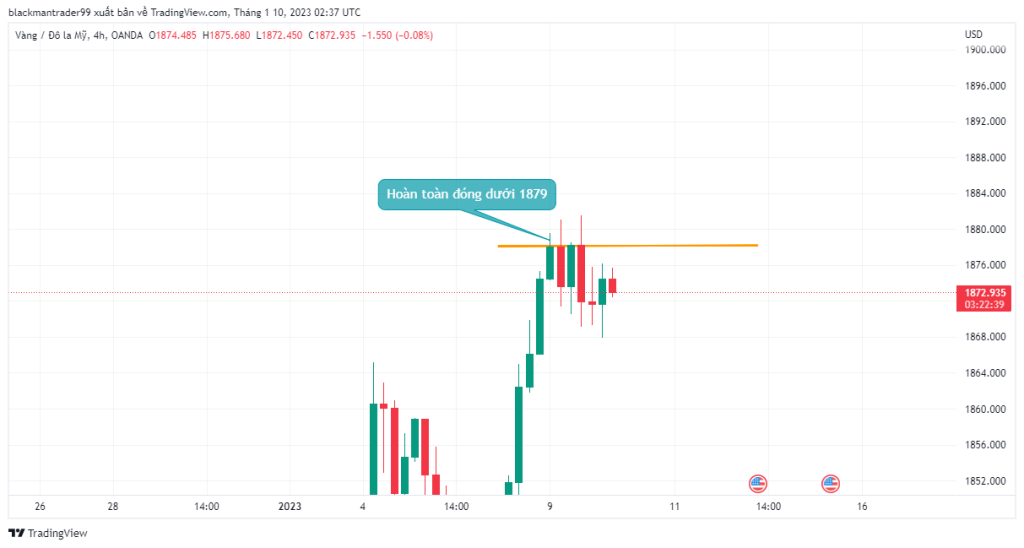
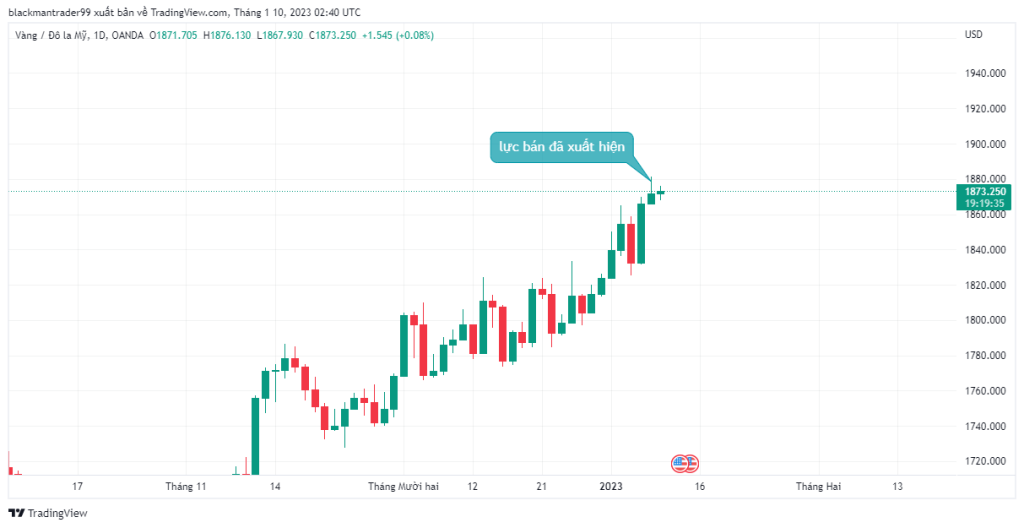
– After reaching the last zone of the Suply Zone , the monthly frame observes the time frames we see:
+ H1 frame: At the 1st touch, it created a reversal engulfing that pushed the market to 1870, then the market rose back to test the newly created peak but was finally hit by the Bears = down again => Create a 2-vertex model

+ H4 frame: continuously long candlesticks retract when touching the last zone of the Supply Zone and there have not been any candles that have closed above 1879, including the H1 timeframe.

+ Frame D1: 1 reversal Pin bar candlestick has appeared at the important resistance zone.

=> From 3 timeframes all give a short-term signal of decline. Today we will wait for Gold to recover around 1876, then enter a Sell order with a stop loss above the Supply Zone with the target of 1855.
Command reference:
Sell 1876
SL: 1882
TP1: 1870
TP2: 1865
TP3: 1860


