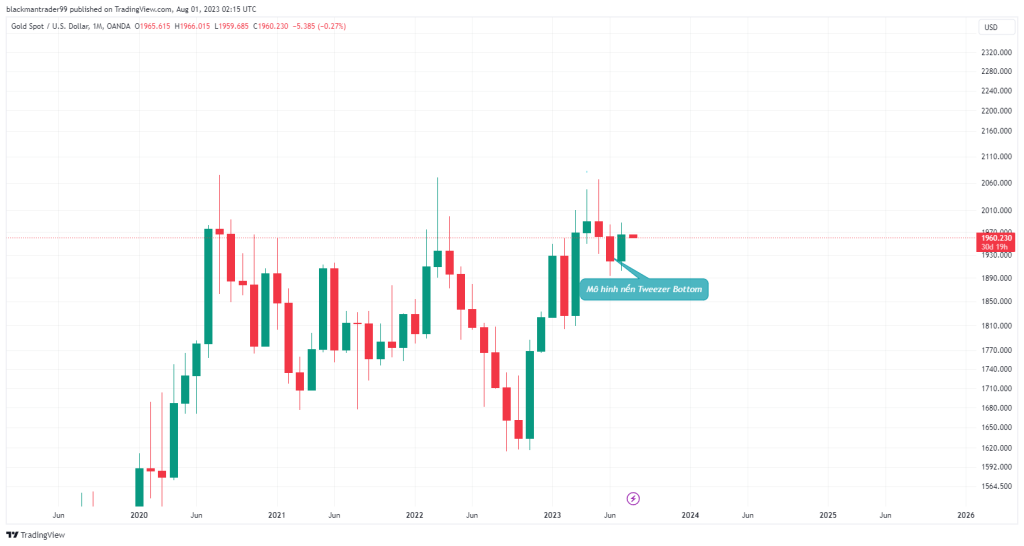
In the long term: last July the market tested around the 1900 area 1 again then rose sharply and closed 1 Engulfing candlestick up around 1965 on the Month timeframe, combined with the 6th candlestick which was 1 bearish candlestick but also retreated when it reached around 1900 => This pair (Tweezer Bottom pattern) shows us that the 1900 area is an extremely supportive zone Well, the probability is leaning towards the long-term upside in the near term towards the 2033 zone in the third quarter when a reversal candlestick has appeared.

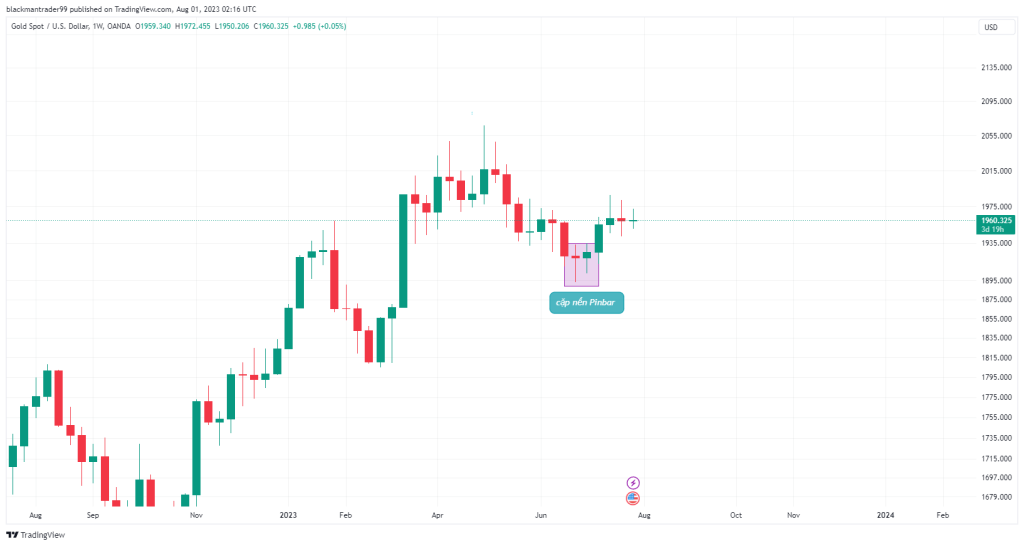
Medium-term: observing the W1 timeframe around 1900, we see that there are pairs of pinbar candlesticks showing a reversal trend, followed by continuous bullish weeks => The uptrend is strong, will soon break the nearest peak of 1985 and reach 2000 possibly as soon as this August.

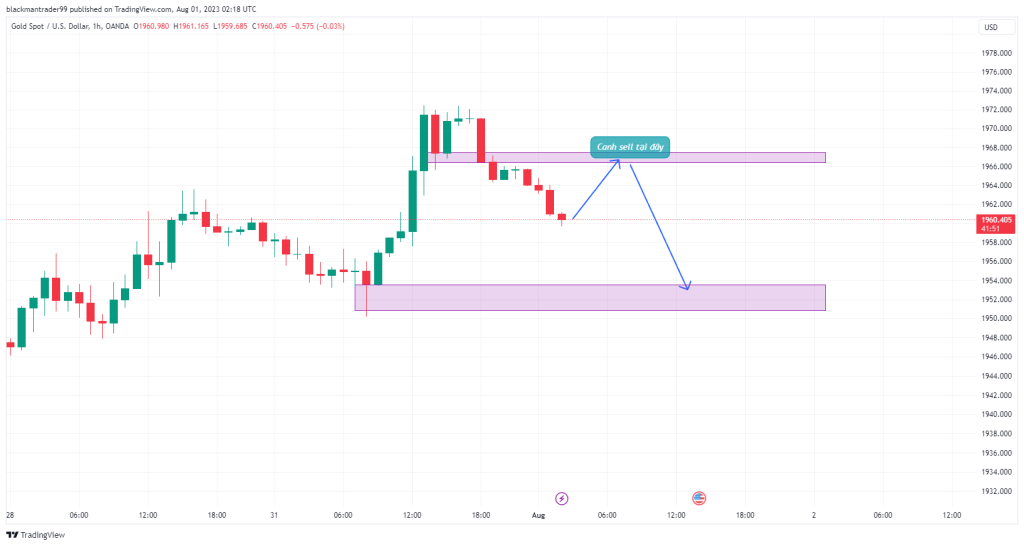
In the short term: The 2nd D1 closes a rather long retraction candlestick when it touches around 1972 – the Supply Zone was very hard earlier. So Blackman will lean down today.
In the Asian Gold session will retest around 1962, which broke yesterday and will gradually increase to the European session around 1967-1968. Here Gold will show a reversal signal starting to decline at the beginning of the US session.

Command reference:
Sell 1967-1968
SL 1973
TP1: 1962
TP2: 1956


