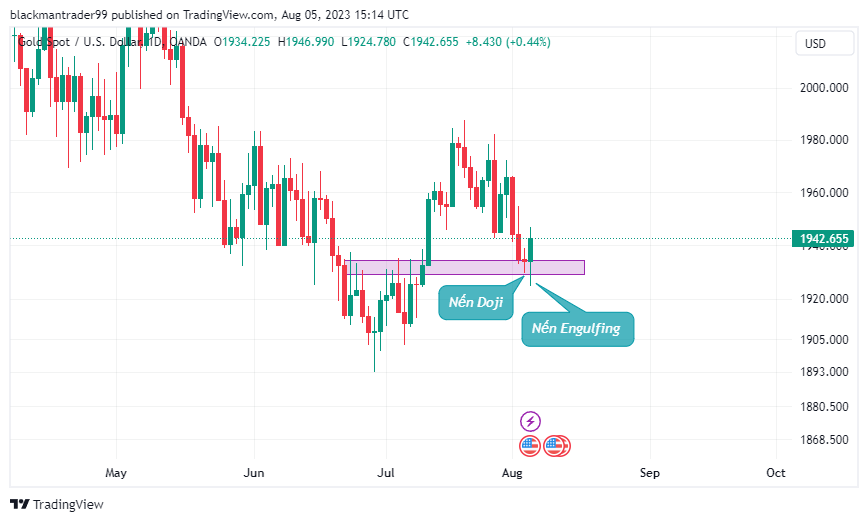
In the first week of August Gold had descending days towards the Demand Zone 1930-1935. Here on the 5th day, there appeared 1 Doji candlestick showing the tug-of-war of buyers and sellers in this zone, then on the 6th day, there appeared 1 strongly bullish Engulfing candlestick => The combination of these 2 candlesticks gives a reversal signal in this Demand Zone.

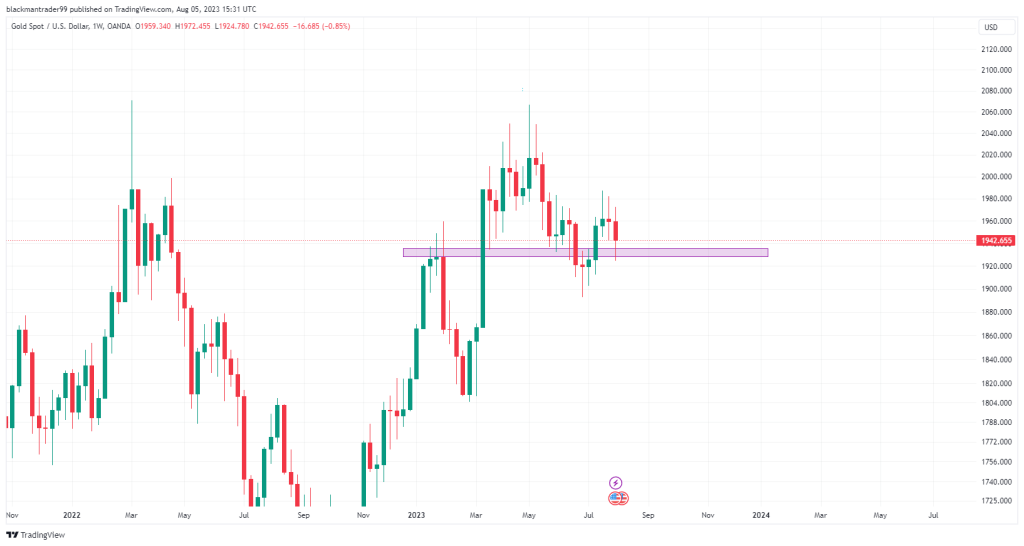
Although W1 candlestick is a bearish candlestick, it has also retreated long legs in this Demand Zone 1930-1935 => showing reversal signals even in the Week frame.

From the above 2 data, it shows that the market is tilted to the upside in the coming time (Short and medium term), Gold will soon reach the 1975 zone 1 again and this time the probability of breaking the barrier will be quite high when this zone has been tested quite a lot of times (Blackman will update further in the following analysis)
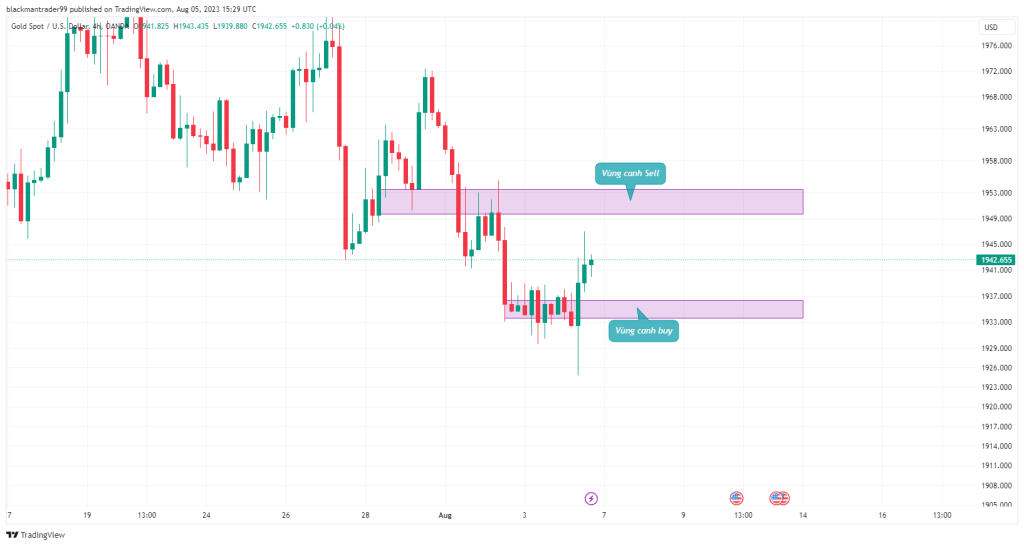
In the short term: At the beginning of the week, we have 2 obstacles to pay attention to, which are the 1935 and 1950 zones, there will be 2 cases as follows:
TH1: If gold continues at the beginning of the week approaching the 1950 mark, we will sell here because previously it was a strong but broken Demand Zone (became a Supply Zone) = > to eat a temporary reversal, the main trend is still bullish.
TH2: If the Belt falls back to around 1935 we will be aligned with the main trend heading first to 1950, beyond 1975 (expect by the end of the week)

Command reference:
Buy 1934 – 1936
SL 1924 (Note Sl Far, Careful Mass)
TP1: 1942
TP2: 1949
Sell 1949
SL 1956
TP 1941


