Gold has fallen consecutively until the 4th week without any strong recovery in recent times. This proves that selling pressure is still very strong, with no signs of reversal.
Observe the timeframes in turn as follows:
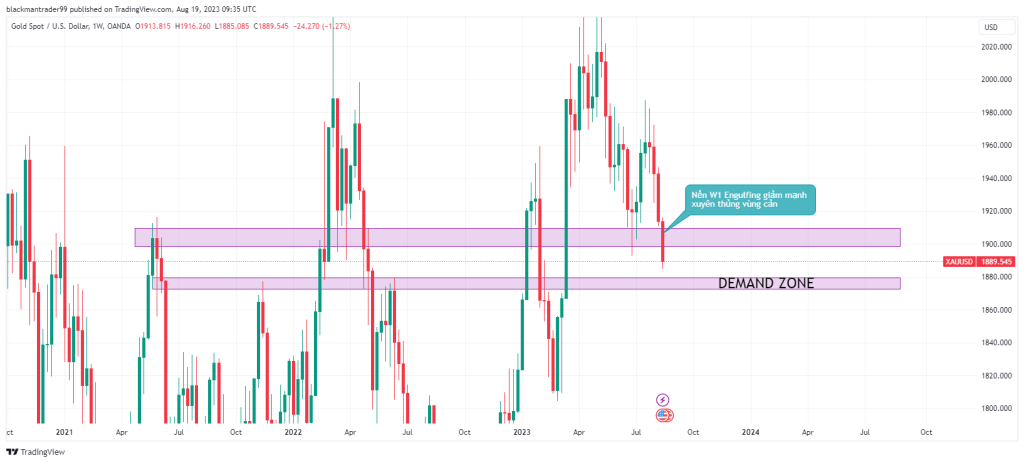
+ Weekly Frame (W1): This week’s W1 candlestick closes 1 Engulfing a marked decrease with an extended range of 250 pips penetrating the resistance around 1900. Currently, Gold has no obstacles around here, the downtrend continues with no signs of stopping. The next Demand Zone was 1876

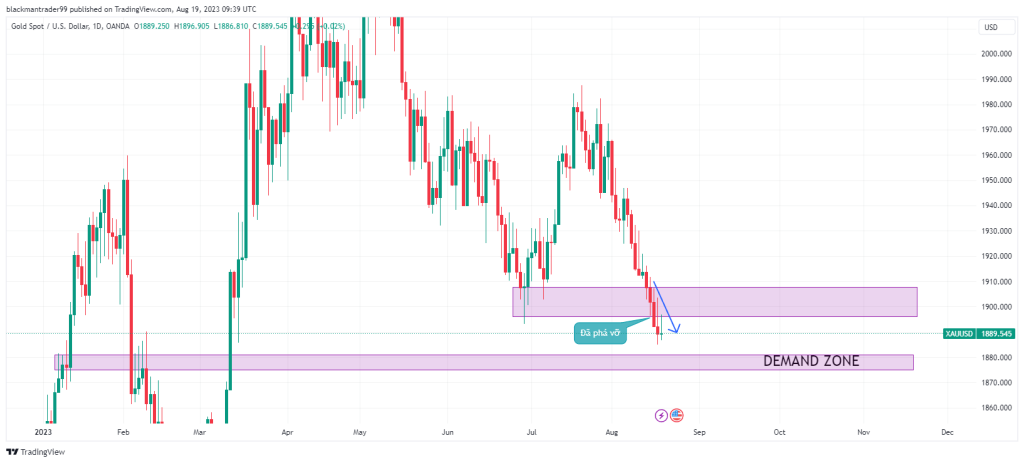
+ Day frame (D1): 3 D1 candlesticks over the weekend officially broke the Demand Zone 1900-1907 (confirmed to break even at W1)

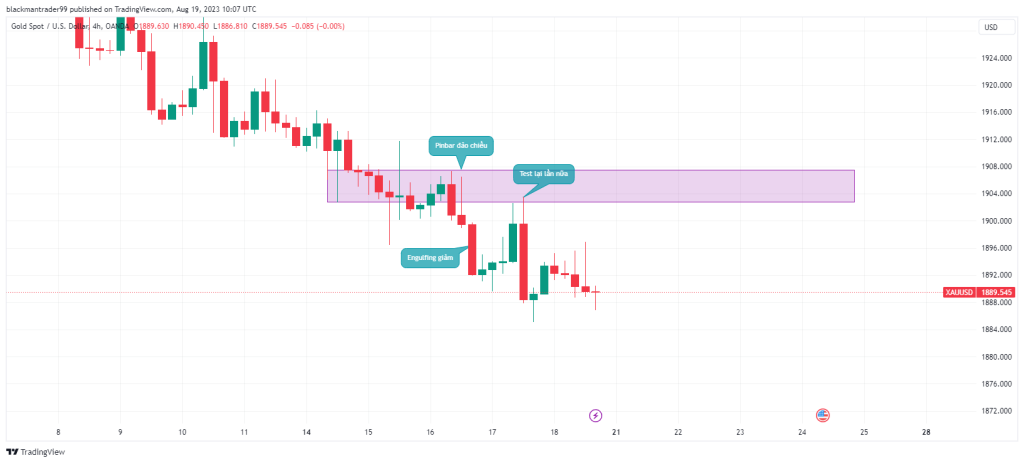
+ H4 frame: the candlesticks tested the 1907 area and appeared a reversal Pin bar candlestick accompanied by 1 bearish Engulfing candlestick. Then the market retested 1 again but the result was still 1 Engulfing plummeted

=> All 3 timeframes give the following signals:
+ The barrier zone 1900- 1907 has been broken, now becoming the Supply Zone
+ The downtrend is still ongoing
+ In the timeframe W1 and D1, there is a confluence resistance zone of 1876
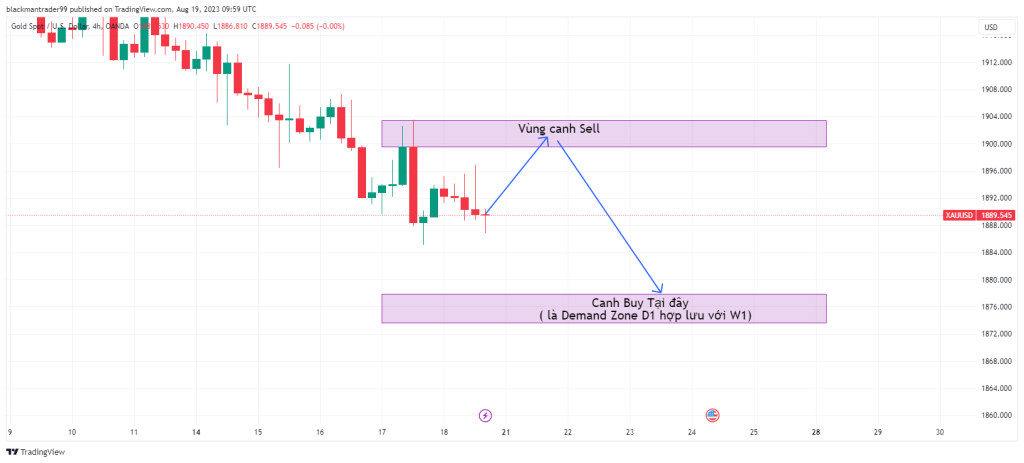
This week, gold will bounce back around the 1900 Supply Zone for a retest (the Demand Zone has just been broken). Here will appear a reversal signal to push Gold further down in line with the Target heading to 1876. Here we will watch for the PRICE REACTION and wait to see how D1 closes the candlestick when it touches this zone before proceeding.
Short term: This 2nd, the Asian Gold Session is likely to have a small margin. It will then gradually increase at the beginning of the European session, lasting until the US session touches the 1900 zone. Here the market will struggle and may reverse sharply during the night

Command reference:
Sell 1900
SL 1910
TP1: 1890, TP2: 1881
Buy 1876
S.L. 1870
TP 1884


