Gold Market Analysis 03/01/2023
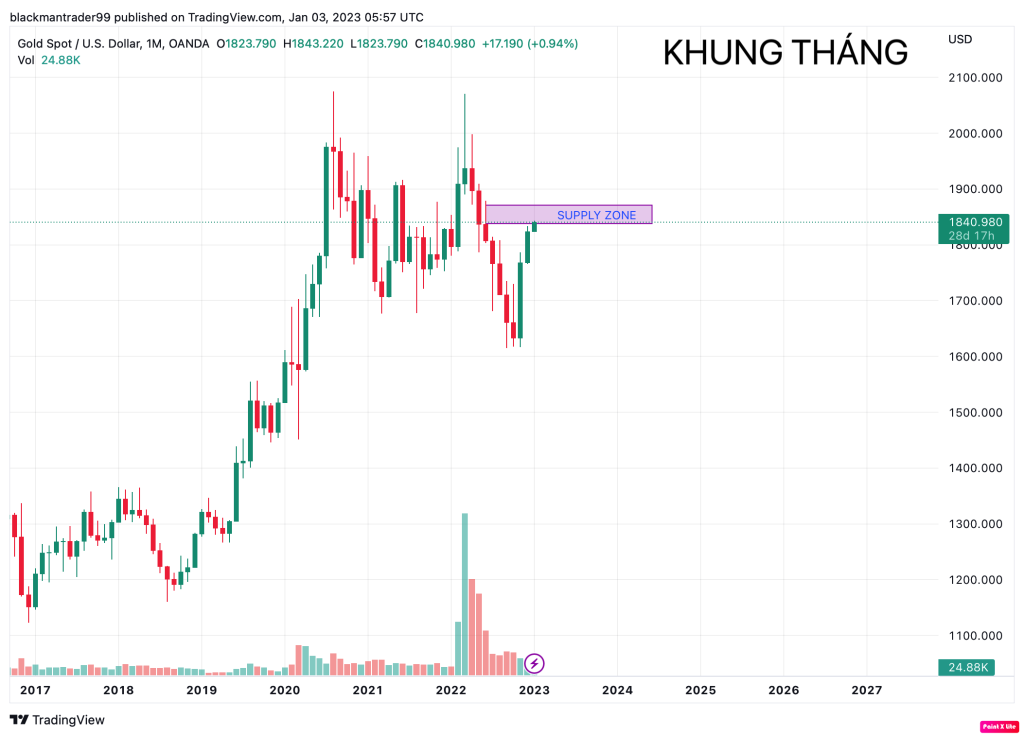
– In the last month of 2022, Gold continued its strong recovery and closed at $1823 per ounce. Here Blackmantrader will analyze the overall picture in the first quarter of 2023 for everyone’s reference:
– Long-term: the Month candlestick (MN) has closed 1 beautiful bullish candlestick showing that the bulls (buyers) are still dominant. However, observing that the market has a fairly hard resistance zone around 1855 – 1860, when Gold comes here, the bears (sellers) will appear to attack, putting pressure on the market to fall again and the closing rate of the January candlestick is quite high.

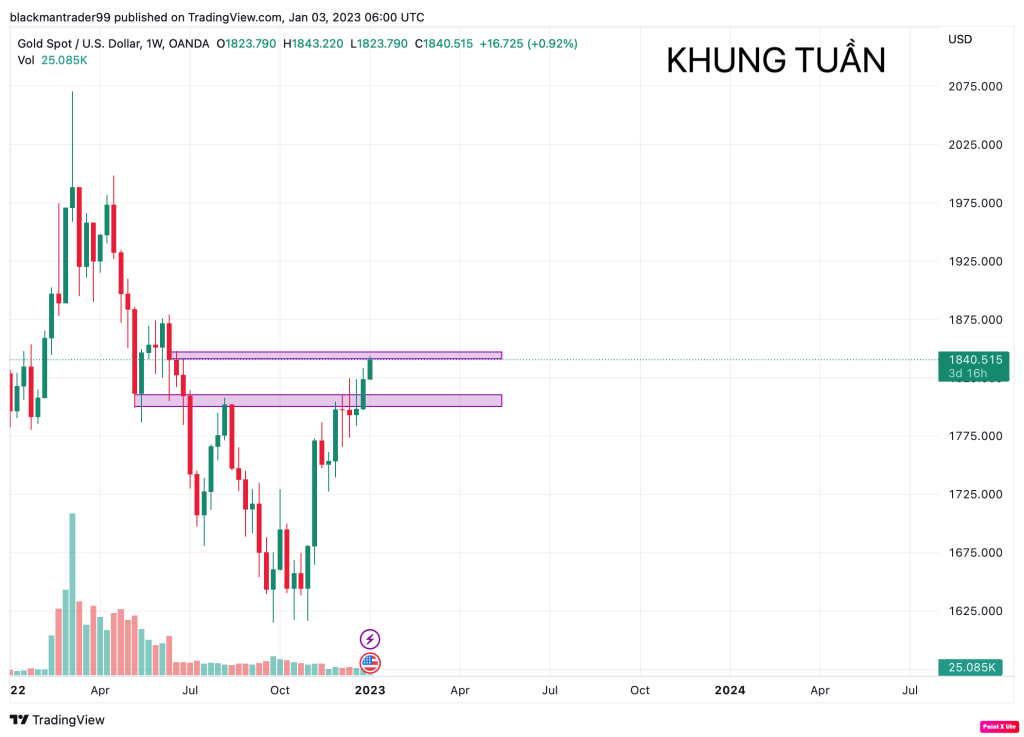
– Medium term: Gold has approached the Weekly Supply Zone as shown below. It is possible that 1 of the next 2 days will have an upbeat to reach 1840, then there will be a reversal signal=> This week’s W1 closed the candlestick bearish around 1815, the target will decrease for a few weeks then will rise again when it reaches 1800.

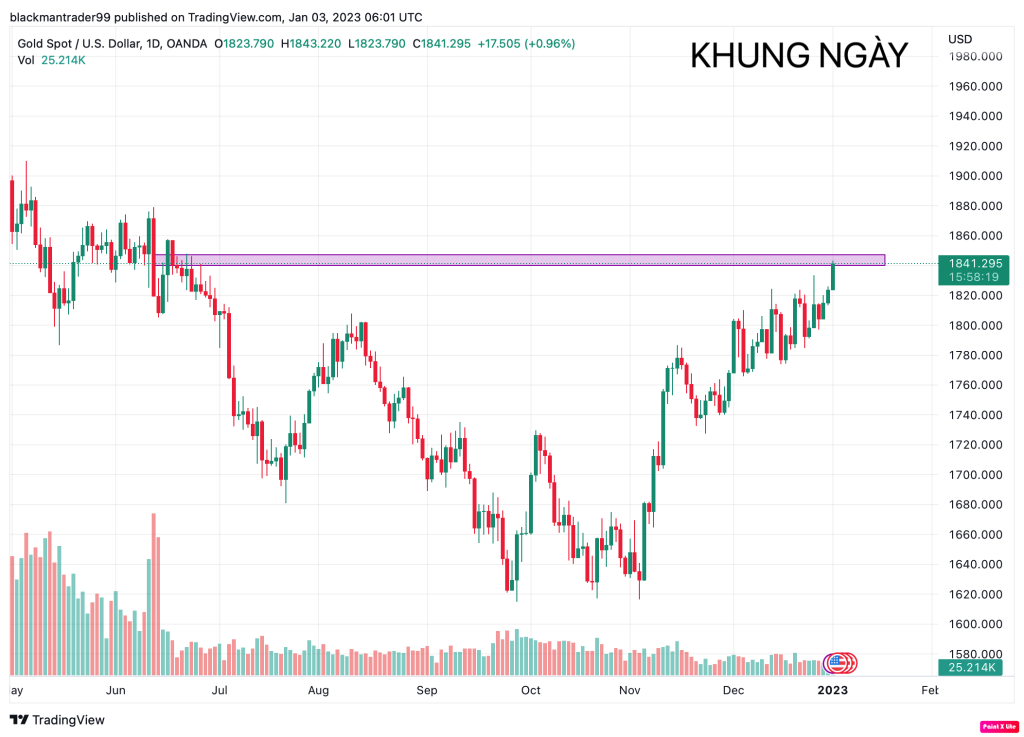
– Short-term: Early in the day Gold may be pushed back to around 1825, after which there will be a reversal signal to the upside on the H1 timeframe.

*Command reference:
+Buy: 1825
SL: 1819
TP: 1834
+Sell: 1840
SL: 1845
TP: 1830


